Before we list the best KPI Dashboard software and tools, let us explain what KPI means. KPI stands for Key Performance Indicator. This is a measurable value that shows how effective a business is in achieving some key objectives. It is possible to use it on multiple levels to evaluate success at reaching the target goals.
There are also High-level KPIs and low-level ones. The high-level KPIs focus on the overall business performance. The low-level ones are mostly about sales, HR support, marketing, and similar things. It may seem a little bit overwhelming at first, but if you only had a little helper by your side, hmm. Well, some tools will help you tremendously with these kinds of things.
Their name is KPI dashboards and tools. With these, you will have all of your important KPIs right there on one dashboard. We collected 11 of those so that you do not need to wander alone through the Internet.
1. Reportz
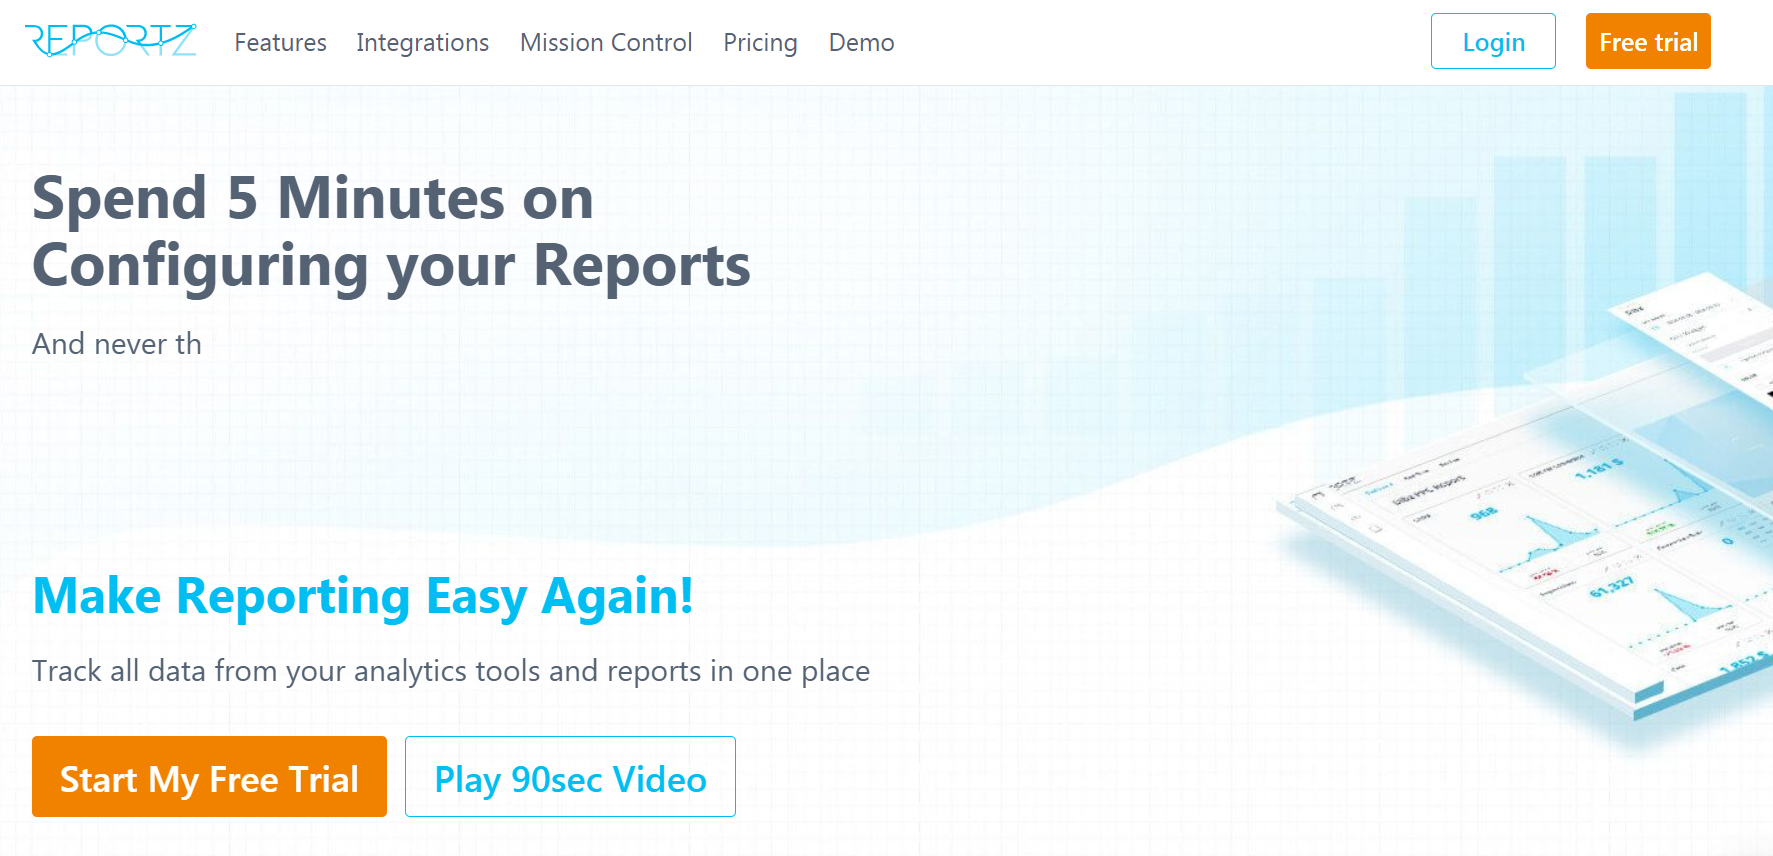
Reportz is our first pick on this list, and for some good reasons. With this one, you can get real-time data that is collected right from your marketing channels. Building new reports can be stressful for sure. Finding the metrics, deciphering KPIs – it’s a lot of work. That’s where this handsome guy slides in.
You can automate the reporting process for your clients and make sure that they get regular updates. The updates will be sent to them while you are enjoying your mojito on a sunny beach in the Maldives. While you are sunbathing, you can add an unlimited number of users to it. That way, every user can collaborate while reporting to their clients.
Customization is a big part of every business. Everybody wants to be special – as they should. You can create a dashboard that is customized with a user-friendly process. You can label it with your brand logos, backgrounds, colors, and more.
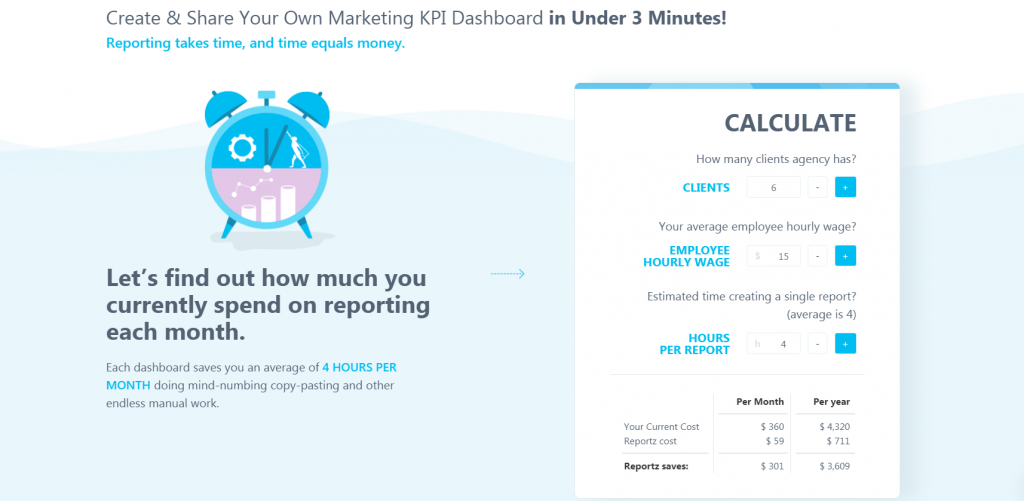
Reportz also gives you some pre-made templates for PPC, e-commerce, SEO, social media, and more – and you can get all of the information that you are searching for in just a few mouse clicks. Amazing, right? And the templates are also fully customizable so that you can edit them to fit your campaign in no time.
Besides, it also integrates with 19 and more major data providers, which will provide you with real-time data from social channels and marketing tools. Simply connect your accounts for Facebook, Linked In, Google Analytics, Facebook, SEMrush to get all the data.
While dealing with sensitive data, it is always important to have top-notch security. With this tool, you can password-protect all the dashboards and only give access to members that you choose.
2. Smartsheet
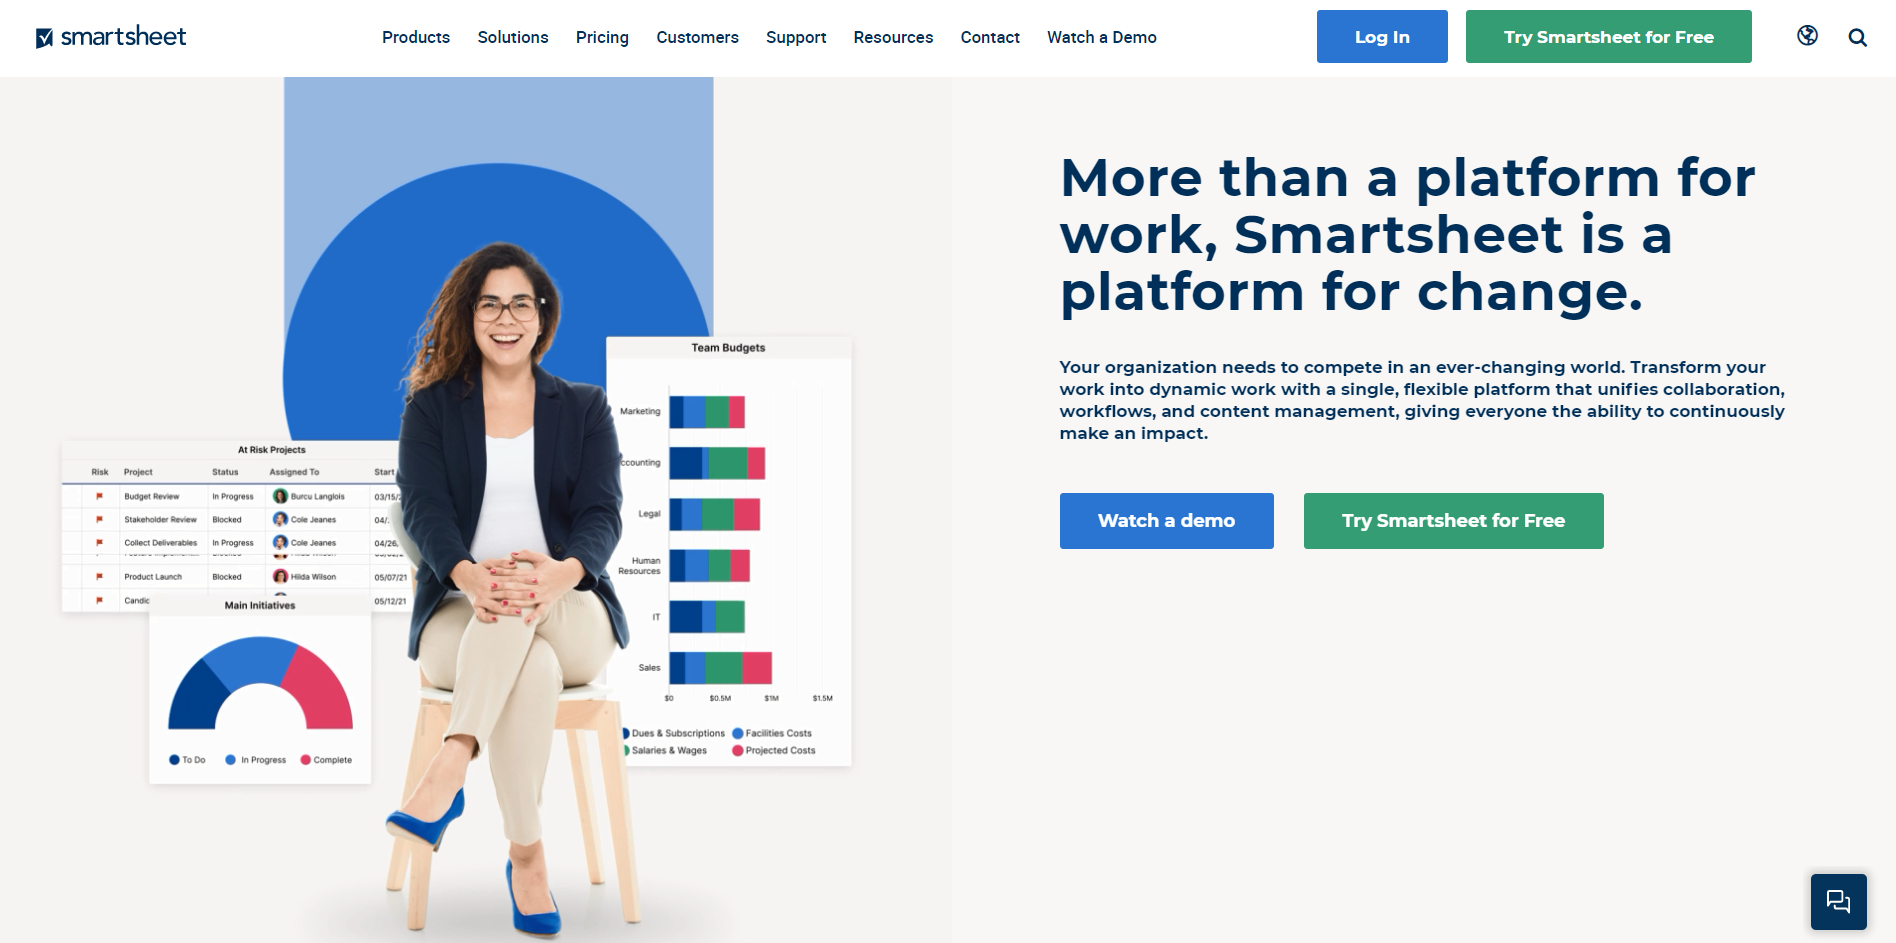
The second tool on our list is Smartsheet. This tool links with third-party apps that allow you to deliver data from the tools that you are already using. Some of the tools are Excel, QlikView, Tableau, Qlik Sense, and others. So, if you are already using some of these, you will be in good hands.
Some other top features are sharing your work with other people on your team or collaborating with them right then and there. You can also set some automated alerts that will remind your team and you in case that anybody forgot. There is nothing worse than passing an important deadline.
That way, you can put reminders for any upcoming task that you have. Besides, you can also see the visual status of projects, view important deadlines that are coming up, and see summary reports.
3. Bilbeo
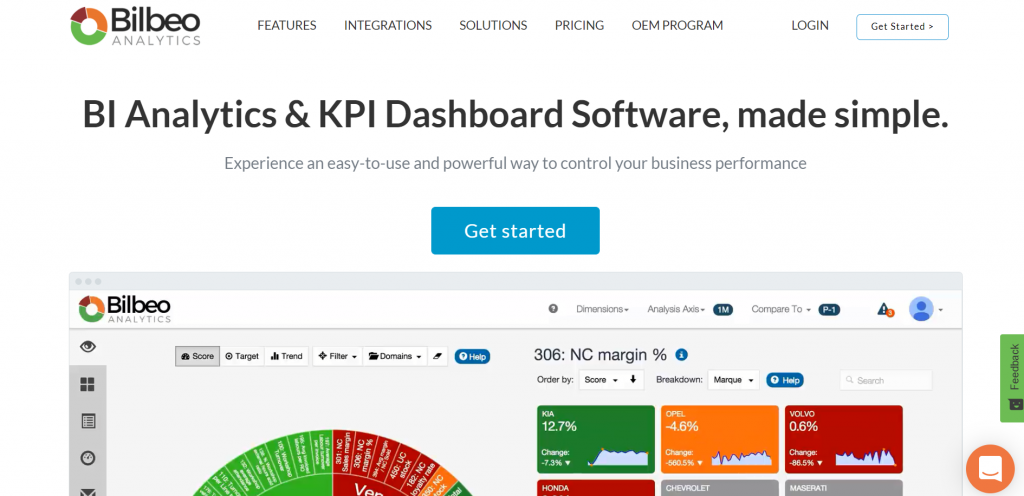
Bilbeo is another KPI dashboard software that is on our third spot. It is a tool that provides an easy-to-use dashboard with some powerful ways to control your business.
Their algorithm and technology automatically create your dashboard just on the data alone. There is no heavy coding or design whatsoever. With their monitoring system, you will never miss a problem that is coming your way, and you will always be informed about anything in your business.
Some other top features are smart alerts, custom reports, unlimited dashboards, and collaboration options.
4. SimpleKPI
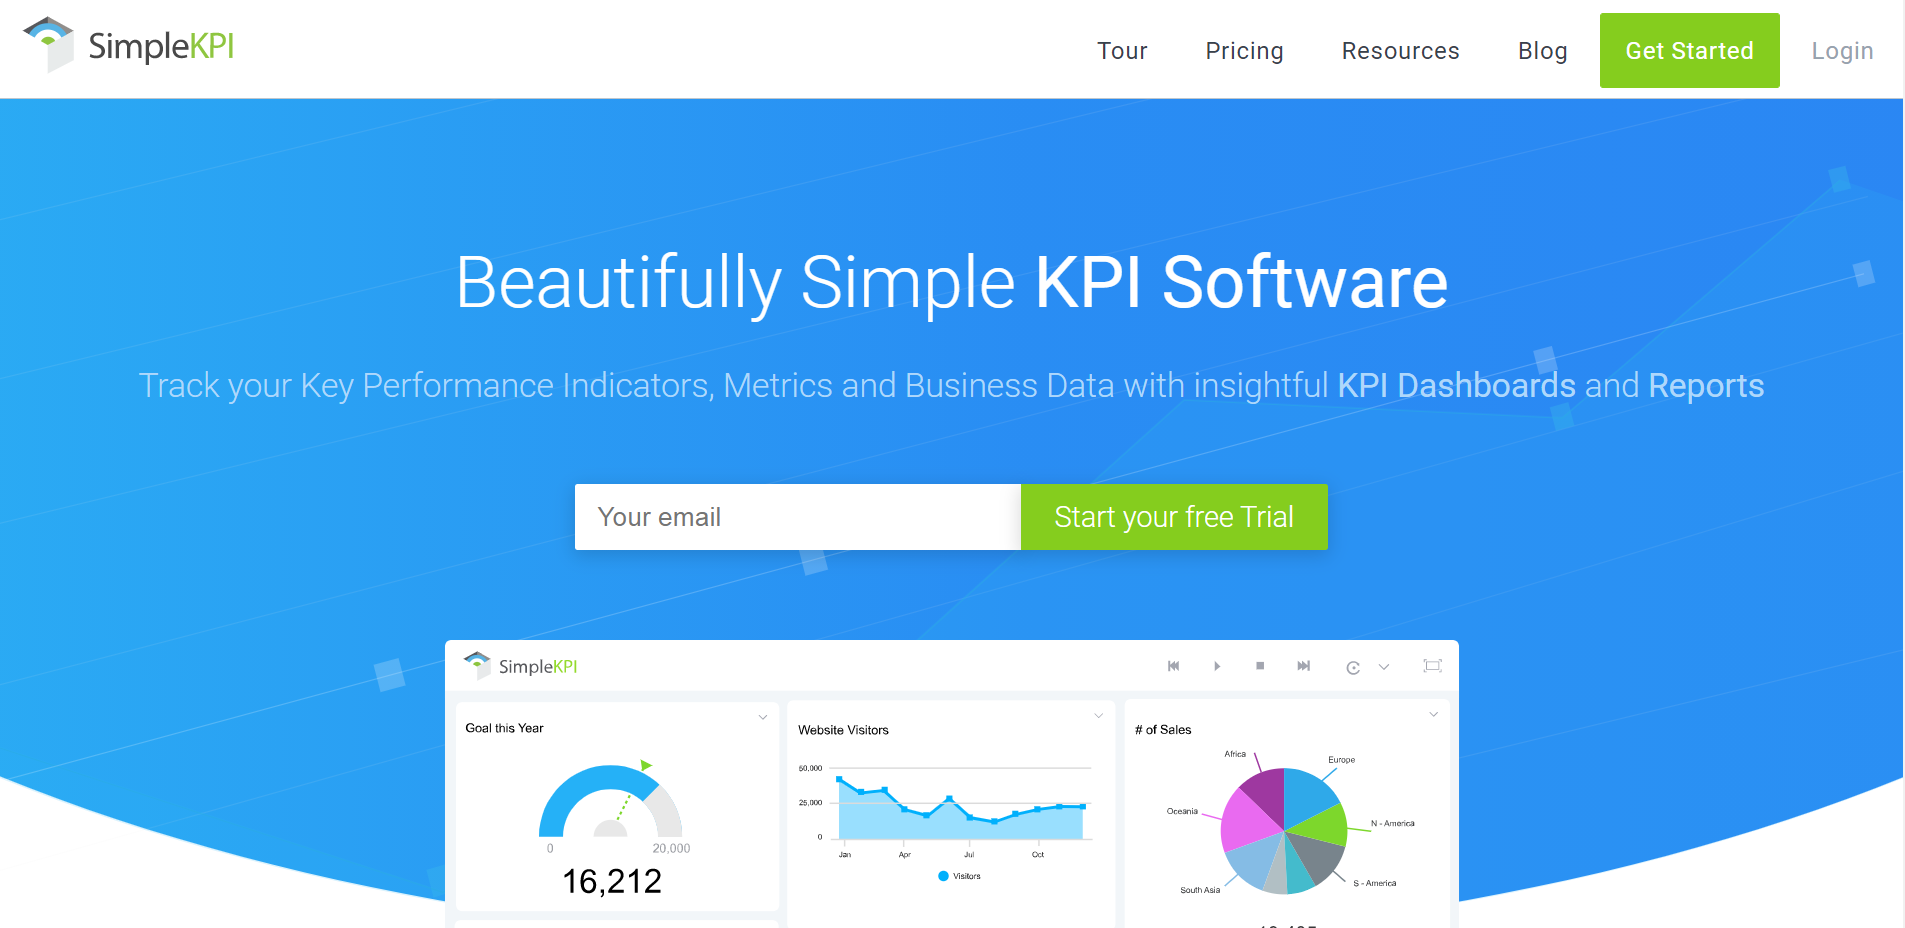
The fourth tool on our list for KPI is SimpleKPI. As they say, simplicity is truly unique among KPI software. With this one, just like with the rest of the tools, you can monitor and visualize your business metrics like a pro. They have easy-to-use features that will tremendously cut time off that is needed to get all of the insight the traditional way.
Some of the features are:
- reports for sharing
- dashboard for monitoring in real-time
- tracking teams, departments, and individuals
It is worth adding that you can turn Excel spreadsheets into a dashboard with this one. So, if you have any spreadsheets before using this tool but want to be in the loop, this is it.
5. DataBox
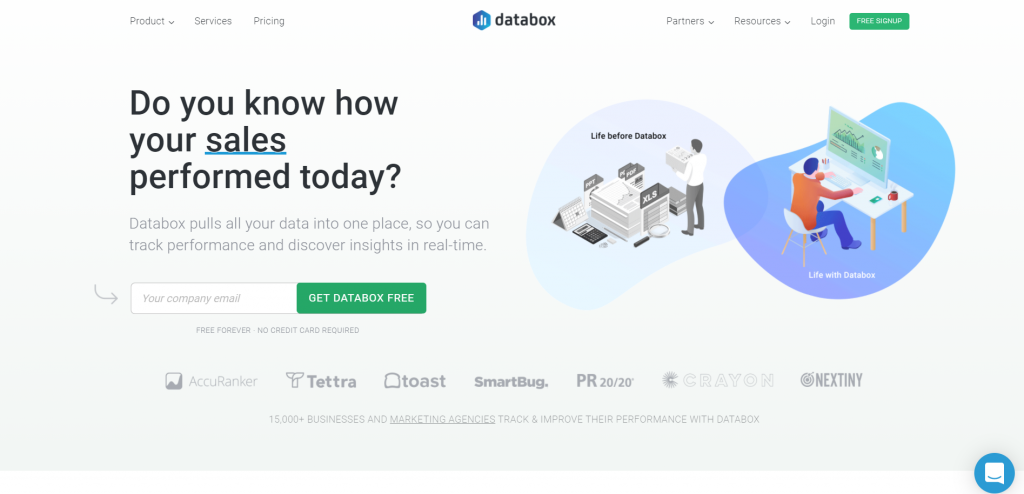
The fifth spot goes to DataBox. If you ever wonder how your performance is going, then hit up DataBox. It will pull all your data to a singular place so that you can see and track performance like a champ.
Did you like the build a bear store? Or did you ever had a secret talent for designing and creating things? If the answer is yes, then this tool will be your best buddy.
There is no coding required, but you can build your own dashboard. Create it the way you want, the way it will feel like you and your brand. Also, you can set goals for some specific metrics if you like. That is possible for any of the 70+ integrations that this tool offers.
6. InfoCaptor
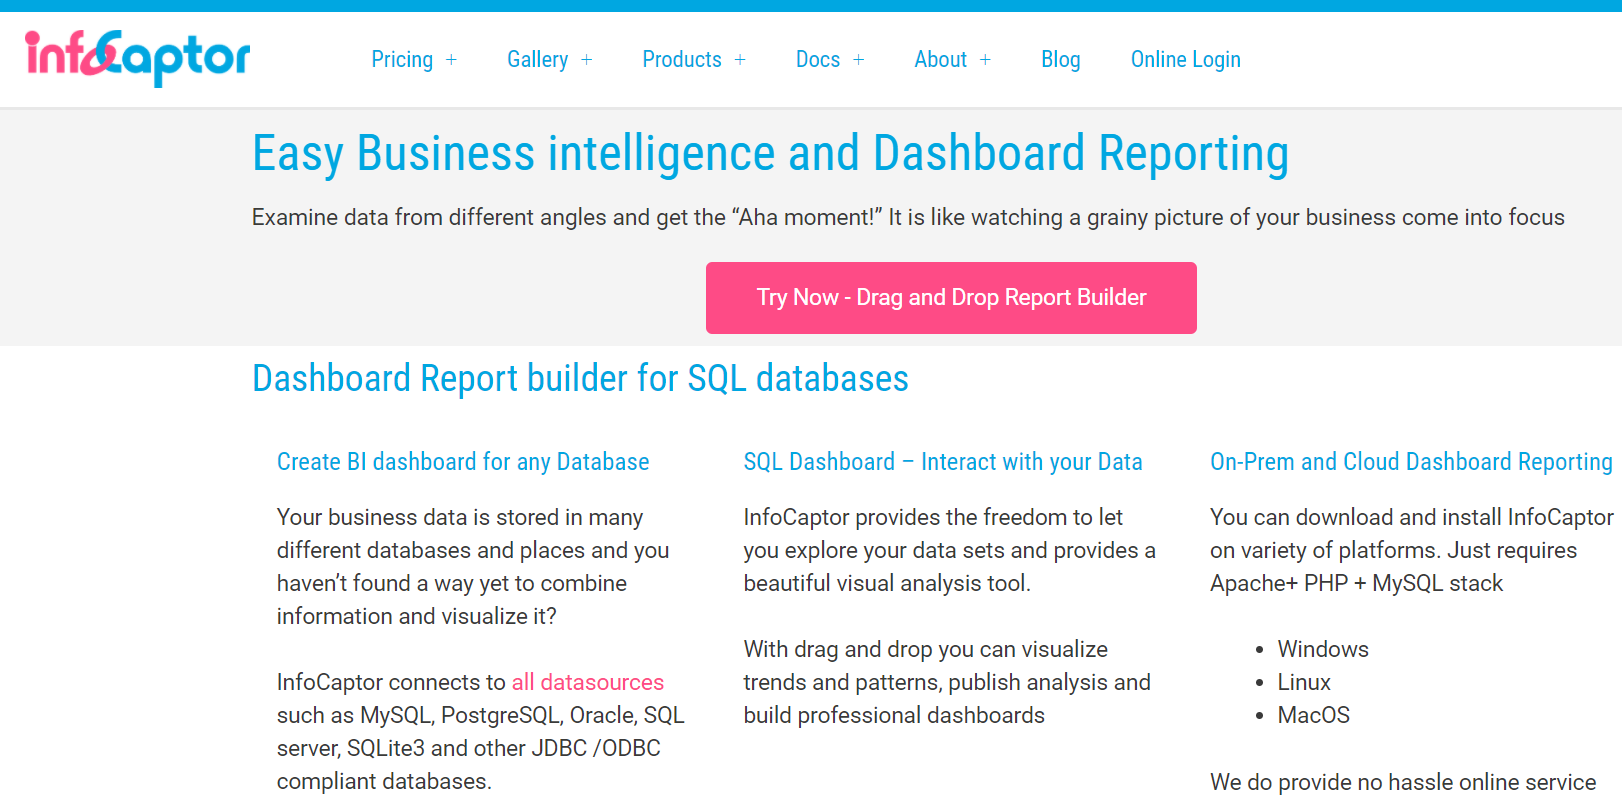
The next KPI tool on our list is InfoCaptor. This gem has easy business intelligence mixed with great dashboard reporting. If you decide to go with this one, you will see your black and white photo coming to life and get that bingo moment.
It can connect to all data sources that you can think of, such as Oracle, PostgreSQL, MySQL, SQLite3, and some other JDBC/ODBC compliant databases. Some top features are rapid analytics, prototyping mockups, ad-hoc visualization, and security and data governance.
7. HandyKPI
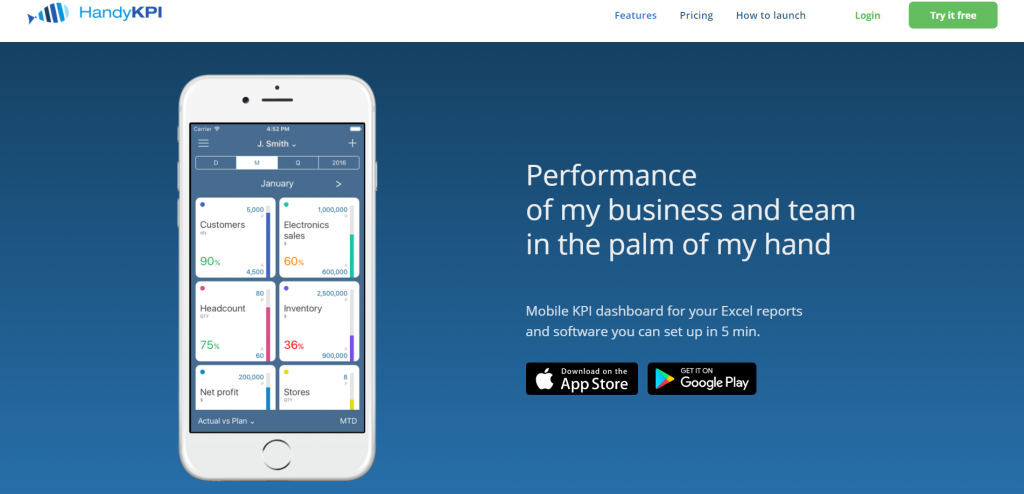
Now, for the 8th spot, we have a pocket version of a KPI – HandyKPI. If you are always on the road and want to check the statistics whenever you please, then this one is for you. We all know the struggle of seeing the stats over the phone. Zoom in, zoom out, move to the left, and so on.
Well, with this one, you can control your business KIPs right from your smartphone.
Right there and then, you can collect or deliver KPIs to your team. No need for opening up the laptop in the airport (flying to the Maldives?) They also have options for you to analyze changes over time, by years, months, or days.
8. Sisense
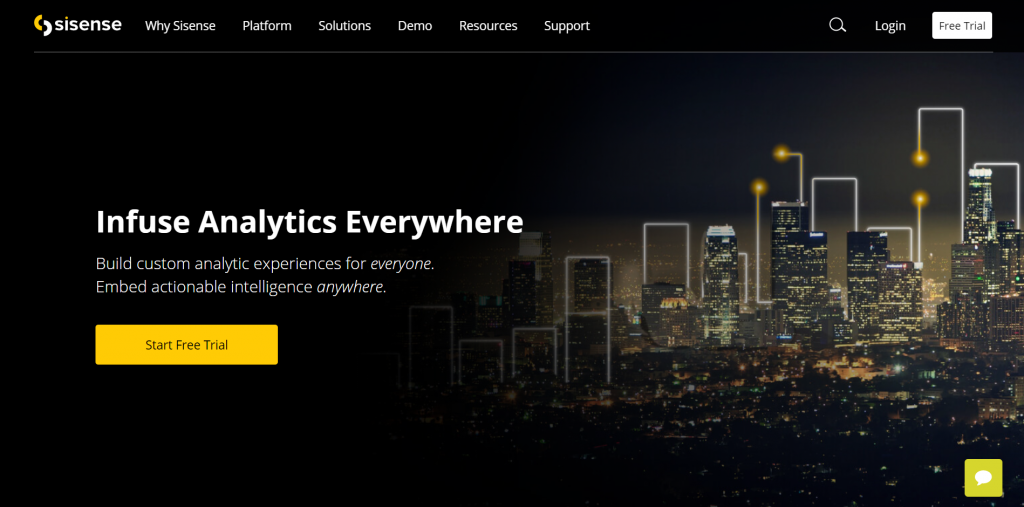
The next spot on our list goes to Sisense. It is probably one of the easiest ways to make great insight from complex data. You can manage and create complex models from many sources with a simple drag and drop option.
You do not need to be tech-savvy for this one. And the data can be any size, location, or shape. Besides, once you do the drag and drop option, then you can see all of your data is transformed into a beautiful visualization.
9. iDashboards
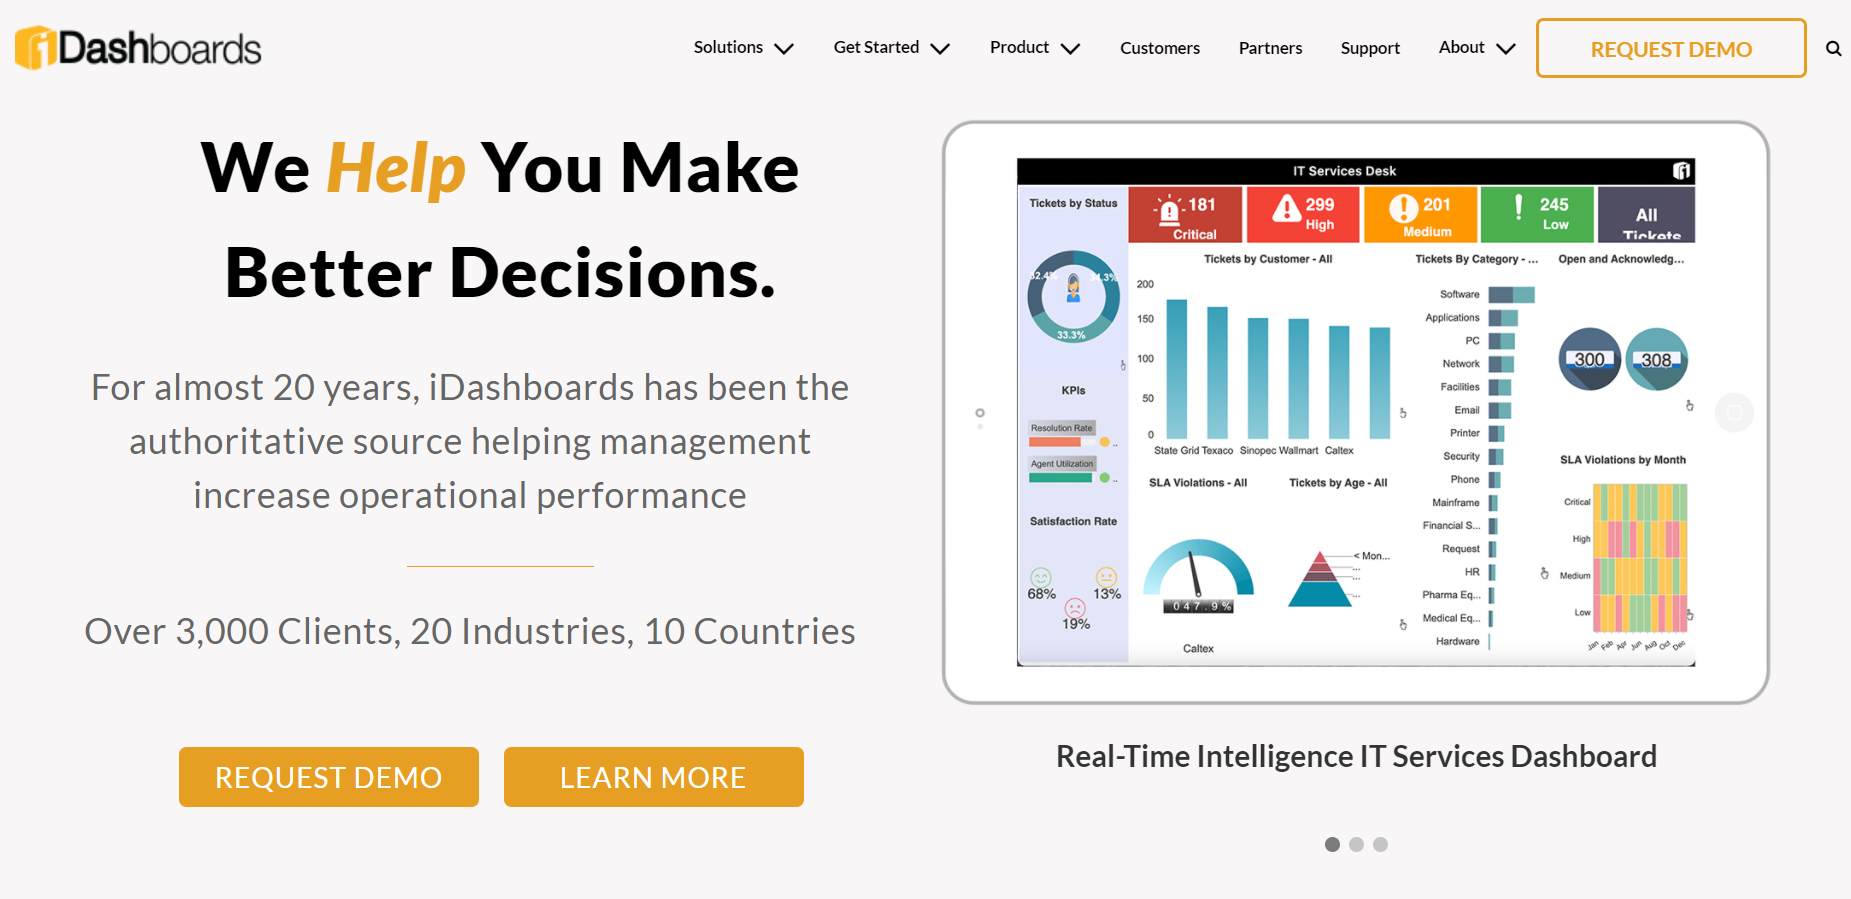
iDashboards is our 10th tool on this list. This tool has been in this business for almost 20 years. It has more than 3,000 clients also, so it must be doing something right.
You can be sure that this one will provide you with quality data. You can combine and connect data from over 160 sources like a pro. Also, you have the freedom to create custom charts and graphs right on the dashboard.
And if you are always on the go, don’t worry – it also has real-time email and text alerts. That way, you will never miss anything important.
10. Spider Strategies
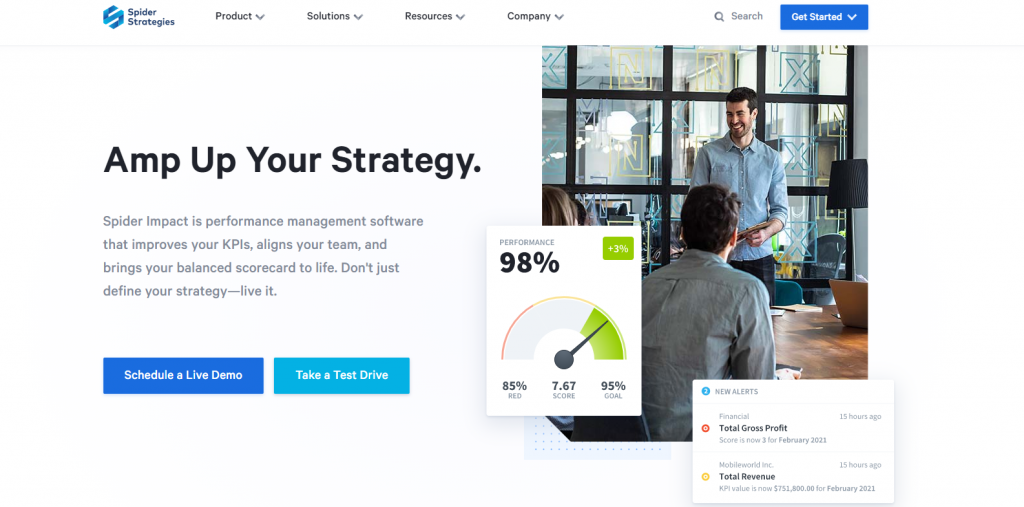
The eleventh tool is Spider Strategies. And this one is built to fit into any industry and any size organization. You can get on-demand data from any perspective that you want. Not to mention, you have strategy maps, scorecards, limitless dashboards, reports, and briefing books waiting for you.
It is great because it works on all devices, from your projector in the board room to the cell phone in your pocket.
11. InetSoft
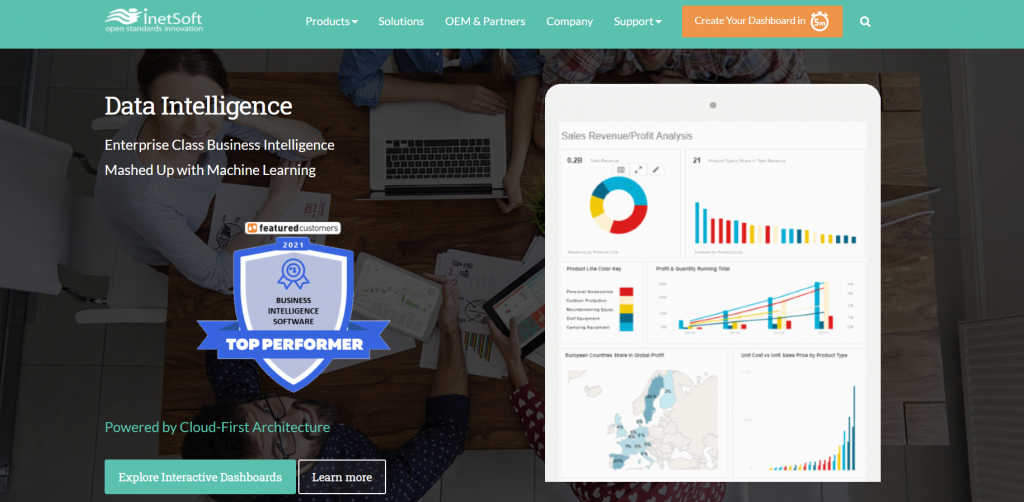
And finally, our last tool is InetSoft. This one works with BI(business intelligence) and machine learning(ML) to provide you with the most accurate info. It also has professional atomic data block modeling, which will help you look professional.
Some top features are:
- Embedded dashboarding
- End-user data mash up right there on the web
- A high performance
- A secure infrastructure
FAQ – Frequently Asked Questions

1. What is a KPI dashboard?
It is a tool that creates a visualization of any KPIs you have selected. KPI dashboards will give you insight into your process in real-time. There is no hard labor for you or any of your workers. The only thing you need to do is connect your data to the tool. And you will have graphics of everything.
2. Why Are KPI Reporting Tools So Important?
KPI tools will help you provide instant snapshots of the overall performance of your company. In those snapshots, you will see the feedback of any performance and see where is room for improvement. That way, you will always see how far away your goal is and if the strategy is working.
3. Can they perform complex analysis of my data?
To answer it shortly, yes. That’s why KPI tools are so great. You need to provide it with your data, and they will do all the heavy work.
4. What types of KPIs can they track?

Honestly, whatever KPI you put, the tools can measure it. That’s only depending on your goal as an organization. Every business tracks different KPIs because everybody has different goals and tasks.
5. What criteria should I look for while monitoring KPIs?
While measuring your KPIs, you shool keep an eye out for SMART. SMART stands for Specific, Measurable, Attainable, Relevant, and Time-Bound. And the best part is that all of this you can see in one place, with just a KPI dashboard.
Conclusion
The conclusion will be short and sweet. If we had to choose one for you, it would definitely be Reportz. It has a bunch of features that will help you be a rock star in your business. The starting price is just $69 – which, in fairness, is a pretty good deal.

