
The success of a company is not just determined by how many products or services it can provide to its customers. On the opposite, it is significantly deeper and includes many other components that contribute to a successful business.
As a result, over the last few decades, many companies have begun to use various techniques and tools for process improvement. These tools are primarily used to identify and resolve issues that may arise during a process, as well as to improve the quality of a product or service. These quality tools that we will discuss in this article are used for data analysis and simplification to determine the best quality and improve the process.
The four quality tools for process improvement are:
- Pareto Chart
- Stratification
- Flow Chart
- Control Chart
Pareto Chart
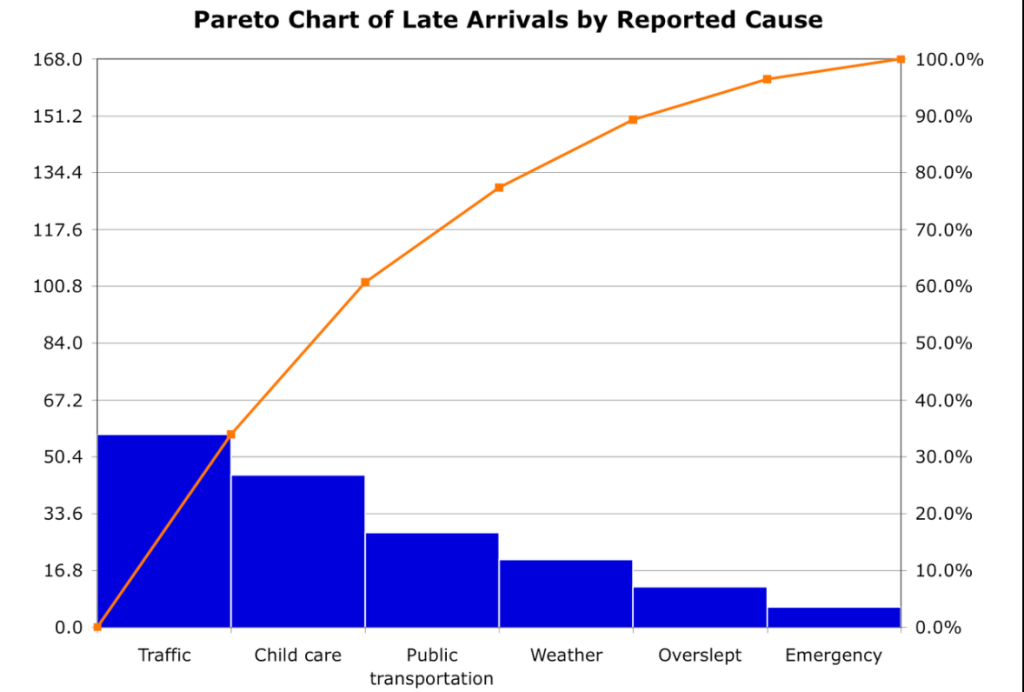
The Pareto chart, also called the Pareto diagram, belongs to the chart-oriented analysis method and is widely used among big companies and organizations in their creation of better strategies and overall improvement of the business. Furthermore, it helps the teams to analyze and focus on which problems they should turn their focus on and solve first.
The Pareto chart is made of rectangle bars where each one represents the frequency parameter with its length. Bars are arranged in a way where the graph starts with the longest bar and goes to the shortest on the right-hand side, representing that way frequency count from highest to lowest.
This way, the problem situations or events are sorted by their significance so your team can focus on the issue that occurs the most and fix it first.
The main rule the Pareto chart implements is the 80/20 distribution rule which states that 80% of an effect comes from 20% of the causes. For example, specifically in business, this can be explained this way: 80% of defects are caused by 20% of processes. This rule can be implemented not only as a business model but in our everyday lives.
Stratification
Sorting objects, people, data, and other objects into well-defined groups can be accomplished using the Stratification method.
This technique is extremely useful during collecting important data when you receive it in a jumble that can be unrecognizable and difficult to observe. Here jumps in the Stratification technique to separate the data into more recognizable samples and groups to have a more descriptive and visually pleasing view of data analysis.
When implementing the Stratification method, it becomes much easier to identify tendencies that cause mistakes and malfunctions, as well as their frequency in a particular business process.
Flow Chart
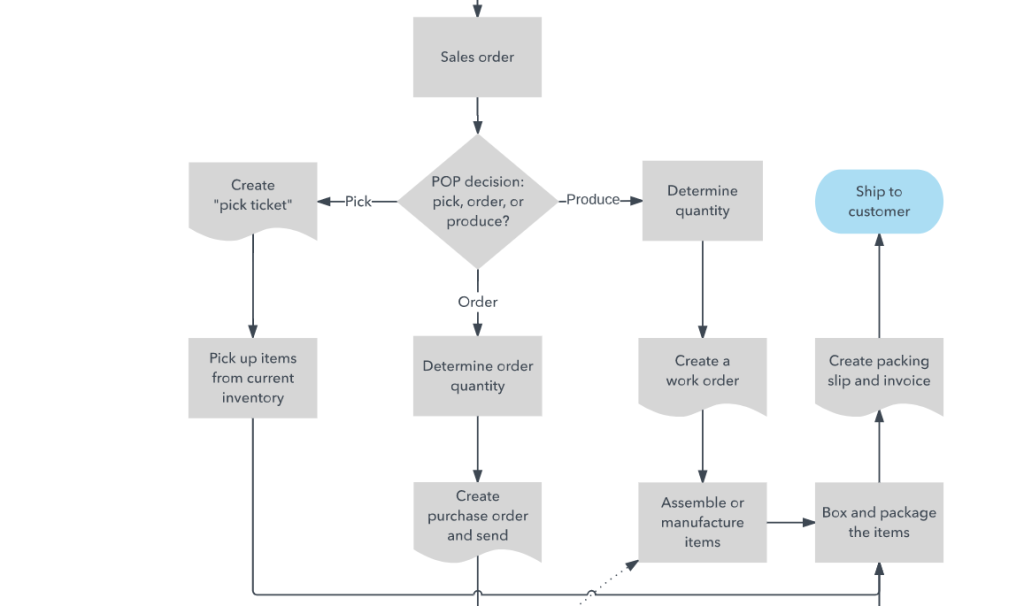
Flowcharts are diagrams that are commonly utilized in many business models and systems. They include a variety of object shapes and arrows that construct flows, routes, and sequences to portray a process or workflow.
They are typically used to simulate simple processes because they are unsuitable for illustrating more complex ones. They are used to visually represent a series of events in a process and underline each step that must be executed to achieve the process’s ultimate goal.
Business models recognize and utilize a few flowchart models, such as Data Flowcharts, Program Flowcharts, System Flowcharts, and Document Flowcharts. It is no surprise that many successful businesses incorporate flowcharts in their operations!
This process improvement method improves communication, creates visual integrity, helps in the development of successful analysis, and involves more people in problem-solving.
Control Chart
A control chart is used to verify the quality of a product or service as well as how a process develops throughout a certain period in one business organization. To put it simply, it shows trends, variations, or tendencies during one process throughout time. It examines all relevant data to generate an average line of quality, which is then presented on a graph.
The graph is composed of three lines: a central line for the overall average, an upper line for the upper control limit, and a lower line for the lower control limit, respectively. This method has proven to be effective and useful because it can determine whether the process is continuous or erratic.
A control chart is especially useful when controlling ongoing processes by identifying and fixing problems as they arise, estimating the expected spectrum of results from a process, and so on.
Final thoughts
A company’s success is reflected in its ability to continuously track all data, deviations, issues, and errors and their causes and to put together the best strategy to handle them and improve the process overall. In this regard, these four high-quality tools are really valuable, and relying on their effectiveness will undoubtedly provide results.